

A line stops. You hear about it when?
Smart MANUFACTURING is the plant supervision application in the Smart SALES suite. Machine status, production orders, stoppages and production stock are read as they happen — not in the next day's report. Smart MANUFACTURING plays the role of an MES (manufacturing execution system) between the ERP and the shop floor.

Yesterday's plant tells its story, today's plant is read
Between what the line does and what the office knows there is a gap. That gap is what costs.
The shift sheet is filled in by hand at the end of the shift. It reaches the office the next day, sometimes on the Monday. Meanwhile a line has stood idle for two hours and nobody has been able to decide anything — not to restart, not to catch up, not to warn the customer.
Smart MANUFACTURING moves the writing to where production takes place. The operator does the logging at the foot of the machine; the status of the line, the quantities and the stoppages go up at that same moment.
What happens on the line is written on the line
Production orders, machine stoppages, quantities achieved: the shop-floor tablet is for nothing else.
Two entries, not twelve
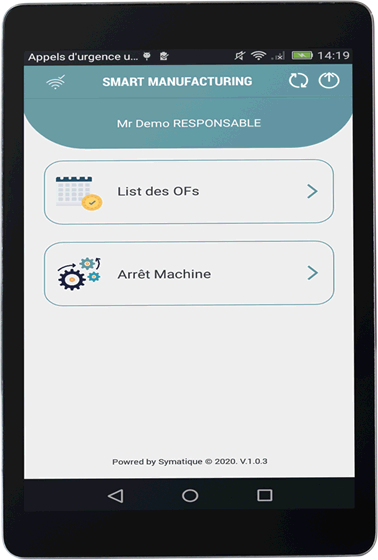
The operator's home screen fits on two lines: the list of production orders, and the machine stoppage log. On the shop floor, everything else is noise.

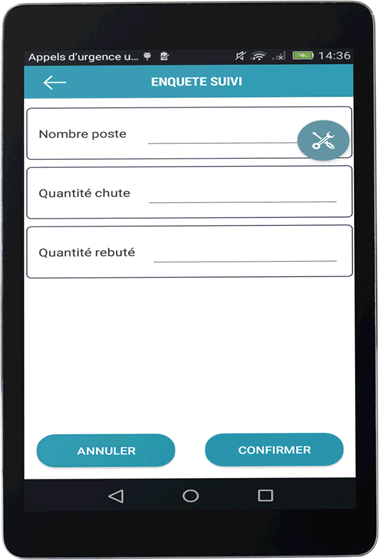
Logging is not one more form to fill in
Three figures entered at the workstation, and the line's quality rate is calculated without anyone copying it out anywhere.
What the supervisor sees
Production reports and the values achieved are tracked supervisor by supervisor. Each one reads their own scope, not their neighbour's.
What the production order carries
- Its generation, from the production programme
- Its planning in the shop-floor calendar
- Its assignment to a line and to a supervisor
- Its tracking, log entry after log entry
- The quantities achieved, the offcuts and the scrap
The stoppage you do not tolerate
A line stoppage is logged from the home screen. It feeds the stoppage dashboard, and above all it lets you step in at the right moment — during the stoppage, not when it is being counted up afterwards.
Every log entry always carries someone's name
Every session is opened by someone. That is what makes traceability possible and per-supervisor tracking legible.
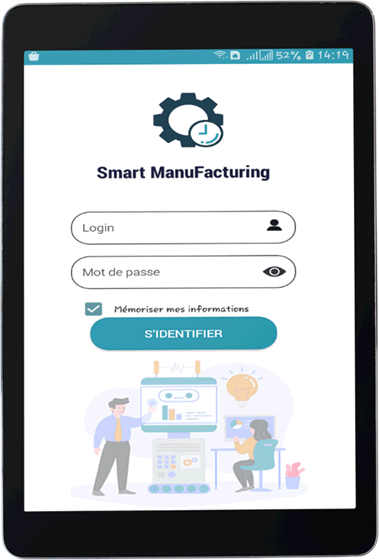
Before logging anything at all, the operator opens a session on the shop-floor tablet. They can ask for their credentials to be remembered: on the shop floor, one device often serves the same workstation all week. The application then displays the profile of whoever is using it, operator or supervisor.
Everything else follows from that. Skills and tasks are assigned; production reports and the values achieved are tracked supervisor by supervisor; and traceability does not cover machines alone.
What the application makes traceable
- Machines — their status, their stoppages and the causes logged
- Operators — who logged what, and from which workstation
- Supervisors — the tracking of production reports and the values achieved, scope by scope
- Skills and tasks — assigned from the organisation, not improvised at the start of the shift
SYMATIQUE puts it this way: supervise machines and operators alike, providing complete traceability of manufacturing information.
OEE is not an opinion, it is a multiplication
Availability, performance, quality. Three ratios, one product, no interpretation.
Overall equipment effectiveness is the only figure that accounts for every loss at once: the time the line did not run, the time it ran more slowly than planned, and the parts that had to be set aside. What is left is the genuinely productive manufacturing time.
Each of the three ratios comes from data logged on the shop floor. The parts count and the good parts count come from the progress log; the run time and the planned time come from the stoppages and the production orders. Nothing is estimated.
SYMATIQUE publishes the formula and its three ratios. The values are those of your own lines: this page puts forward none of them.
OEE = Availability × Performance × Quality
- Availability — run time ÷ planned production time
- Performance — (ideal cycle time × total parts count) ÷ run time
- Quality — good parts count ÷ total parts count
Formula and definitions published by SYMATIQUE on its Industry 4.0 page.
Drive
Charts and event summaries by line, by day or by week. Performance reports are built from a library of indicators — OEE, overall yield rate, quantities produced and losses, failure rate, causes of stoppage and non-conformity. Reviews and minutes are customised by function: production, quality, maintenance.
Improve
Analysis is built in and follows how efficiency evolves over the medium and long term: that is how you know whether an improvement measure has produced anything. The causes of non-productivity and non-quality are identified, and the data can be exported to be worked on elsewhere.
What comes in, what goes out, and what the ERP knows of it
Raw materials and finished goods are tracked in the same place. And the plant stops being a blind spot in the management system.
Stock movements of raw materials and of finished goods are managed in the application. They are the two ends of one and the same movement: what the workstation consumes and what the line produces. Logging one amounts to writing the other.
This is where Smart MANUFACTURING stops being a shop-floor tool alone. SYMATIQUE presents it as the digital link that was missing between the ERP and the plant: the orders come down, what is achieved goes up, and nobody copies anything out in between.
What production stock makes possible
- Raw materials — their movements tracked as the workstation logs come in
- Finished goods — the quantities achieved, offcuts and scrap deducted
- The alert — being notified at the right moment, rather than when the stock-out is discovered
- The connection — the Smart SALES platform interfaces with the information system already in place, which stays in place
Eight functions announced, and the publisher promises more
We publish only the ones that are named. The others are discovered in the demonstration.
Four of them happen on the shop floor, on the tablet. The other four are read in the office, on a dashboard. That is the only split the documentation allows, and it describes the day rather well.
The shop floor 4
-
Production linesThe status of each machine in real time: in production, waiting, fully stopped
-
Production ordersGeneration, planning, assignment and tracking
-
Production stockThe movements of raw materials and of finished goods
-
InterventionAct at the right moment when a line stoppage cannot be tolerated
Oversight 4
-
Production reportsThe dashboard tracking their completion, supervisor by supervisor
-
Production achievedThe dashboard of production and of the values achieved, by supervisor
-
Machine stoppagesThe stoppage dashboard, line by line
-
ChecklistsThe checklist dashboard, just like production
The list published by SYMATIQUE ends with “and many other features to discover”. We have taken up only what is named: what the page announces, the demonstration must be able to show.
A tablet on the shop floor, the platform at head office
The application does the logging, the platform consolidates, your management system stays in place.
Smart MANUFACTURING sits on a shop-floor tablet: few entries on screen, large targets, standing use with gloves on. The home screen offers the operator only what they have to do, and synchronisation is triggered from the top bar.
The device displays the profile of whoever is using it. That is what lets one and the same fleet of tablets serve several workstations and several teams without mixing up the logs.
The application is connected to the Smart SALES back office: master data, production orders, indicators, consolidation of the logs. It is through the back office that exchanges with your ERP pass — the platform is modular and interfaces with any information system at all.
The organisation can be multi-user, multi-profile, multi-subsidiary and multi-site: privileges and levels of visibility are configured, site by site and profile by profile.
What people ask us before the first line is equipped
No. It makes the link that was missing between the ERP and the shop floor: production orders come down, production logs go up. Your own management system stays in place, and the platform Smart SALES interfaces with it.
Three, in real time, on the production lines: machine in production, machine waiting, machine fully stopped. The stoppage is logged with its cause and feeds its own dashboard.
OEE = Availability × Performance × Quality. Availability is the run time divided by the planned production time; performance is the ideal cycle time multiplied by the total parts count and divided by the run time; quality is the good parts count divided by the total parts count. This is the formula as published by SYMATIQUE; the values are those of your own lines.
On an Android tablet, on the shop floor. The interface is touch-based and designed for standing use at the workstation. The Smart SALES platform also drives Android and iOS mobile applications for the other trades in the suite.
Yes. Performance reports are built from a library of indicators — OEE, overall yield rate, quantities produced and losses, failure rate, causes of stoppage and non-conformity. Reviews and minutes are customised by function: production, quality, maintenance. The data can be exported.
A production line replayed with your own production orders
One order, one line, one logged stoppage, one OEE figure worked out in front of you. Forty-five minutes, no commitment.
- A demonstration on your own lines, production orders and stoppage causes
- A technical contact, not a salesperson
- A reply within one working day
- Your data is used only to reply to you